First
Run the free check
Use one finished result to decide whether the output is clear enough for your grower, advisor, or field lead.
Finished sample check
The sample shows one finished check. Field Change Alerts turns that same output into ongoing monitoring: new scenes are filtered, changes are ranked, and alerts tell you where to walk first.
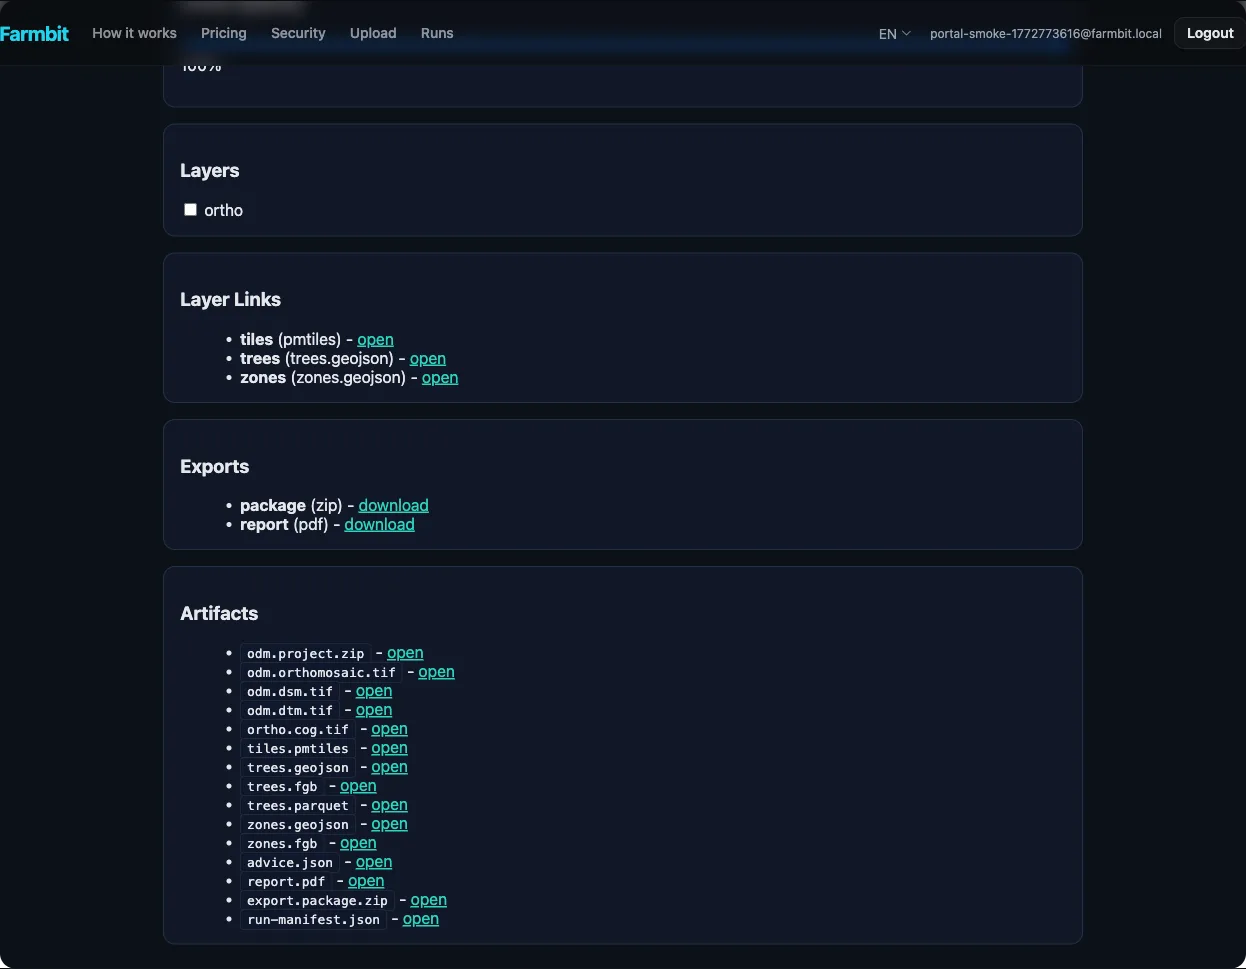
Report ID
#AG-7742-ORC
Location
Kelowna, BC
Latest scene
2026-03-06
Imagery date
2026-03-06
Boundary / confidence
Shifted sample geometry; confidence notes stay visible before action.
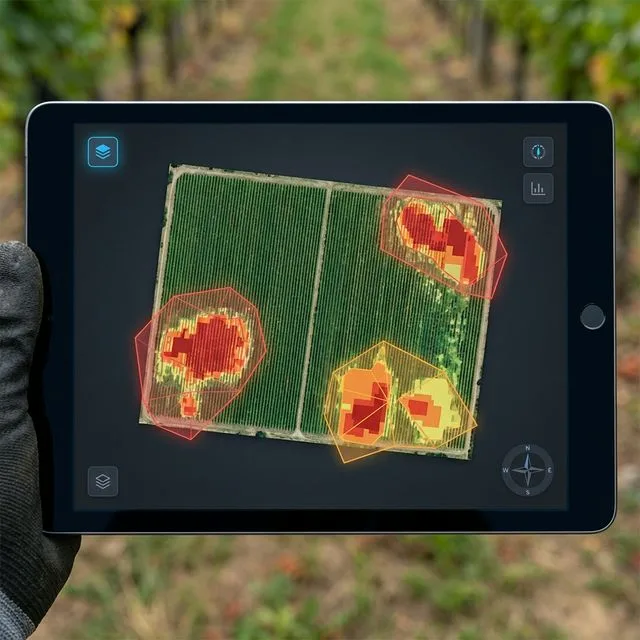
Walk-first zone
Zone 03
Ground checks
Compare flagged rows with normal rows, then capture canopy, soil, and emitter evidence.
Limitation
Satellite triage, not diagnosis. Field evidence is required before agronomic intervention.
Paid closer-check trigger
Escalate only if the first walk still leaves the block unresolved.
Why subscribe after the sample
A free check proves the format on one block. Field Change Alerts keeps selected blocks under watch, filters noisy scenes, and sends a plain alert when the change is worth a field check.
First
Use one finished result to decide whether the output is clear enough for your grower, advisor, or field lead.
Then
Subscribe the blocks where a missed change would cost time, irrigation mistakes, or a delayed scout.
Ongoing
Each alert keeps the same practical structure: what changed, where to walk first, what to verify, and what Farmbit cannot prove.
Reviewed first-walk brief
The free orchard check now supports a reviewed first-walk brief by email: block/date checked, imagery source/date, confidence, where to walk first, and what satellite evidence cannot prove.
Recommended action
The sample block shows one area that changed more than surrounding rows. Walk that zone first, then verify irrigation, canopy condition, or recent management activity before acting.
Key metrics
This public sample uses shifted geometry to protect the original block. The zone ranking, evidence layout, and note format match the real field check.
Sample metrics are shown for workflow demonstration. Field validation is required before agronomic intervention.
See the orchard stress pageSignal strength
Mixed
Clear enough to pick a first-walk zone, not enough to diagnose a cause.
Boundary confidence
Reviewed
The sample keeps boundary and confidence notes visible before the next action.
Next step
Walk first
Check the priority zone on foot before treatment or closer capture.
Temporal comparison
Put the earlier checkpoint beside the latest read so you can judge whether the same zone is getting worse or settling down before people head out.
Baseline read
2026-02-18
Baseline Latest read
2026-03-06
LatestWhat this first read can and cannot say
Most of the block reads normally, while the first-ranked rows changed more than their neighbors and deserve a targeted check.
The note does not confirm water stress, pests, disease, or treatment need. It tells the field team where to look and what evidence to collect.
Priority zone
Zone 03
Evidence note
Check irrigation, canopy, and recent field activity
Next-step sequence
Zone 03 moved into the first-walk slot because it changed more than surrounding rows between the earlier and latest checkpoint.
See which part of the block deserves the first walk.
Use the brief to align what the field team should verify on the ground.
Pass the same priority map to the advisor or GIS tool without rebuilding the note.
Priority-zone sequence
This table turns the ranked zones into a short field sequence with confidence and action labels before the truck leaves the yard.
Run the same check on your own block
The subscription is not a bigger dashboard. It is the same ranked map, short note, and walk-first list delivered again when a monitored field changes.